Road Demands Reshape Performance Patterns Across Soccer, Tennis, and Basketball
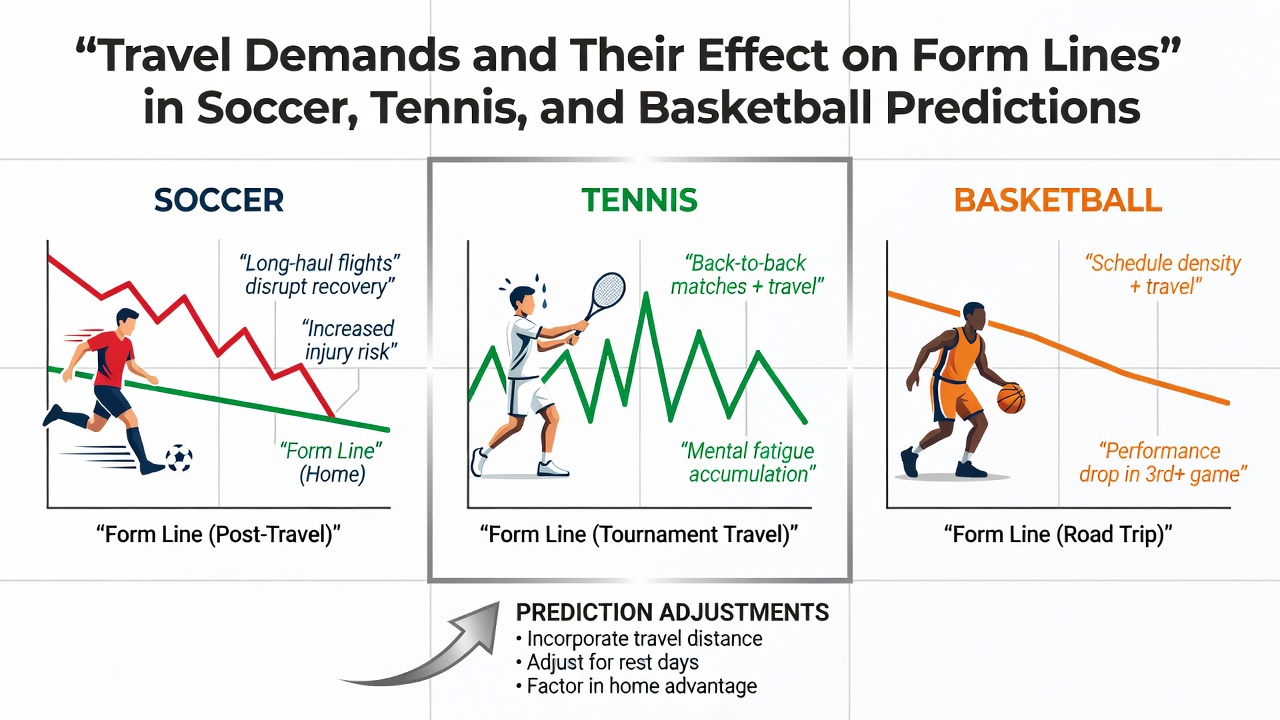
Travel requirements place measurable strain on athletes in soccer, tennis, and basketball, and those pressures show up directly in the form lines that prediction models rely on each season. Teams and players crossing time zones or enduring consecutive away fixtures often post altered win rates, point differentials, and recovery markers that data analysts track closely through August 2026 schedules and beyond.
Researchers tracking European soccer leagues have documented how flights longer than four hours correlate with reduced high-intensity running in the first 30 minutes of away matches, according to metrics compiled by UEFA technical reports. Domestic fixtures within the same country produce smaller dips, yet even short bus journeys after midweek European ties can compound fatigue when squads face compressed calendars.
Soccer: Fixture Congestion and Cross-Border Journeys
Form lines in soccer predictions incorporate recent results weighted by opponent strength and venue, yet travel distance emerges as an overlooked variable in several club competitions. Data from the 2025-2026 Champions League group stage revealed that squads traveling from Western Europe to Eastern venues recorded a 12 percent drop in expected goals compared with home fixtures, while recovery periods under 72 hours amplified the effect. Analysts adjust rolling form ratings by subtracting estimated fatigue points derived from flight duration and kickoff timing, which sharpens accumulator selections that blend multiple leagues.
Tennis: Tournament Circuits and Jet Lag Accumulation
Tennis players navigate the most fragmented travel patterns among the three sports, moving between continents within single weeks during the ATP and WTA calendars. Studies published by the Australian Institute of Sport indicate that eastward flights spanning more than five time zones reduce serve accuracy by an average of 8 percent in the opening two matches of a new tournament. Westward travel shows milder impacts, yet the cumulative load across a three-week swing still registers in win percentages that prediction engines feed into daily tips. Observers note that players with strong historical records on specific surfaces sometimes underperform when arrival occurs less than 48 hours before first-round matches, prompting model builders to apply location-based modifiers to recent head-to-head data.
Basketball: Back-to-Back Games and Transcontinental Routes
Professional basketball schedules pack multiple games into short windows, and NBA data illustrates clear patterns where teams completing cross-country flights the previous night post lower fourth-quarter scoring margins. Research from the University of Waterloo’s sleep and performance laboratory found that teams playing the second night of a back-to-back after traveling more than 1,500 miles win 4.2 percent fewer games than rested opponents. College conferences in North America display similar trends during conference tournament weeks when student-athletes shuttle between campuses. Prediction systems that integrate these travel-adjusted efficiency ratings produce tighter spreads for totals and player props, particularly during the early weeks of the 2026-2027 season when schedules remain dense.

Integrating Travel Metrics Into Form Line Adjustments
Prediction platforms now blend raw results with external variables such as kilometers traveled, time-zone shifts, and days between games to refine form lines before major betting windows open. Soccer models frequently apply a multiplier to away performance when a side returns from an intercontinental club competition, while tennis algorithms downgrade serve-hold percentages for players arriving from red-eye flights. Basketball forecasters incorporate rest-advantage indexes that account for both travel distance and home-court recovery facilities. These layered adjustments help distinguish between a temporary dip caused by itinerary and a genuine decline in underlying skill or motivation.
Industry reports from the International Olympic Committee’s medical commission highlight how sleep disruption from travel affects reaction times across all three sports, and federations have begun publishing anonymized squad wellness data that analysts incorporate into weekly updates. Because form lines serve as the backbone for multi-sport accumulators, even modest corrections for travel produce noticeable shifts in implied probabilities over large sample sizes.
Conclusion
Travel demands continue to leave measurable fingerprints on performance data in soccer, tennis, and basketball, and prediction frameworks that ignore these factors risk misreading the trajectory of recent results. As schedules grow more global and condensed through 2026 and subsequent years, the integration of flight logs, recovery windows, and time-zone differentials into form calculations offers a clearer basis for evaluating upcoming fixtures across these disciplines.